The amount of data being gathered by my Homematic setup is growing. And some of the data is pretty useful to graph. Unfortunatly there is no option in the Homematic software to create graphs of data. I already have a nice cacti setup to graph other data, so it makes sense to use cacti to graph the homematic data. To do this I made a script to get the data from the homematic ccu and translate it to a format cacti can understand. To make this work you need the XML API patch on the homematic ccu (http://www.homematic-inside.de/software/addons/item/xmlapi). The script I to interface can be downloaded from the link below: To use the script, please look at the start of the script and atleast enter the right URL for the location of the homematic CCU (URL variable). If you want to change the location of the cache file or the configuration file, adjust the variables. To start you need to download the xml configuration from the homematic ccu. Run the script to download: homematic.sh updateThe cache file should now be generated, default is in /tmp/homematic.cache. To process the config into something readable for cacti a configuration file is needed. The hard part is to make the configuration file, or at least find the correct id for the device you want to graph in cacti. As an example I will use my outside temperature/humidity sensor. Open the cached configuration file in your favorite editor. Now you have to find the relevant part in the file relating to the sensor. My sensor is named “Temperature balkony” in the CCU, so the part relating to the sensor in the xml configuration looks like this: This looks pretty daunting :) What you need to look for is the channel that contains the information you need. I want to have the temperature and the humidity from my sensor, so the relevant part of the xml file is: What you need from this piece of the xml file is only the ise_id of the channel. In this case it is 1501. With the information we can make a configuration file. Open the file in your editor (default is /etc/homematic.cfg). We will make a category temperature and add the balkony sensor to it. This looks like: [temperature]
balkony 1501The script can now be used to retrieve the information from the xml file. Run the script with the cateory and sensor name: homematic.sh get temperature balkony
TEMPERATURE:10.600000 HUMIDITY:66And there you are, the relevant data from the xml file in cacti readable format. Now you can create a new data input method in cacti and specify the settings as seen in the screenshot below: [cacti-2.png cacti-2.thumb.png cacti-3.png cacti-3.thumb.png cacti.png cacti.thumb.png]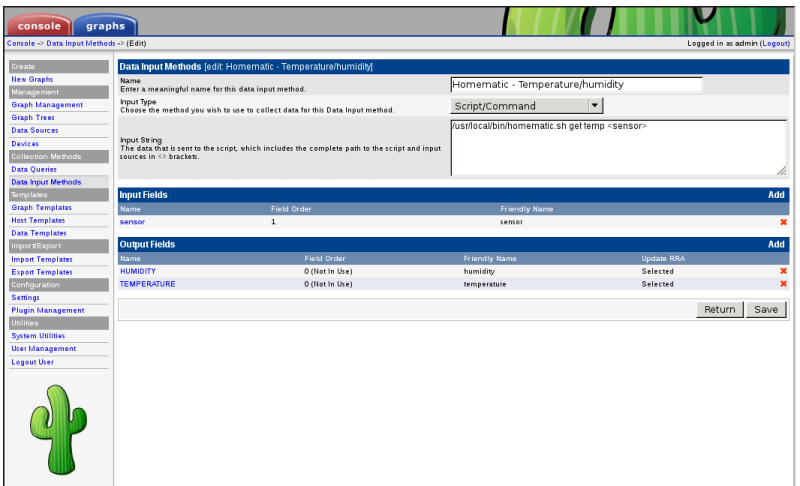 By using the sensor tag you can define graph templates that reference the sensor you use when creating a new graph. This allows for a more flexible setup. [cacti-2.png cacti-2.thumb.png cacti-3.png cacti-3.thumb.png cacti.png cacti.thumb.png]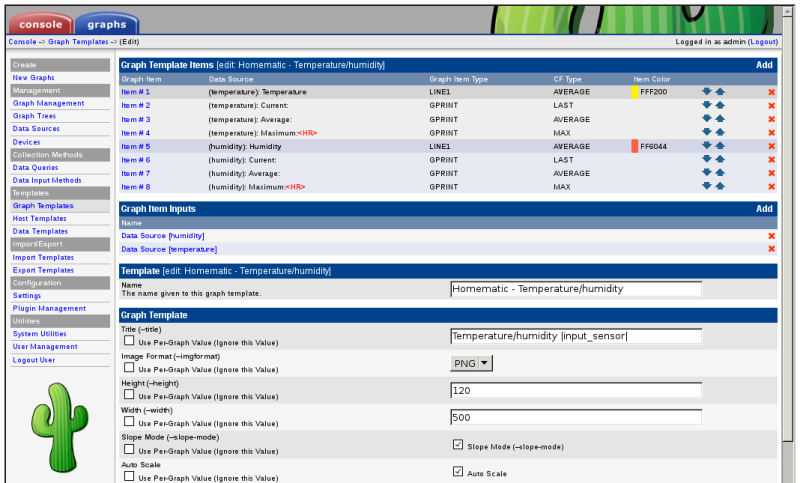 Using this setup you can get graphs like below: [cacti-2.png cacti-2.thumb.png cacti-3.png cacti-3.thumb.png cacti.png cacti.thumb.png]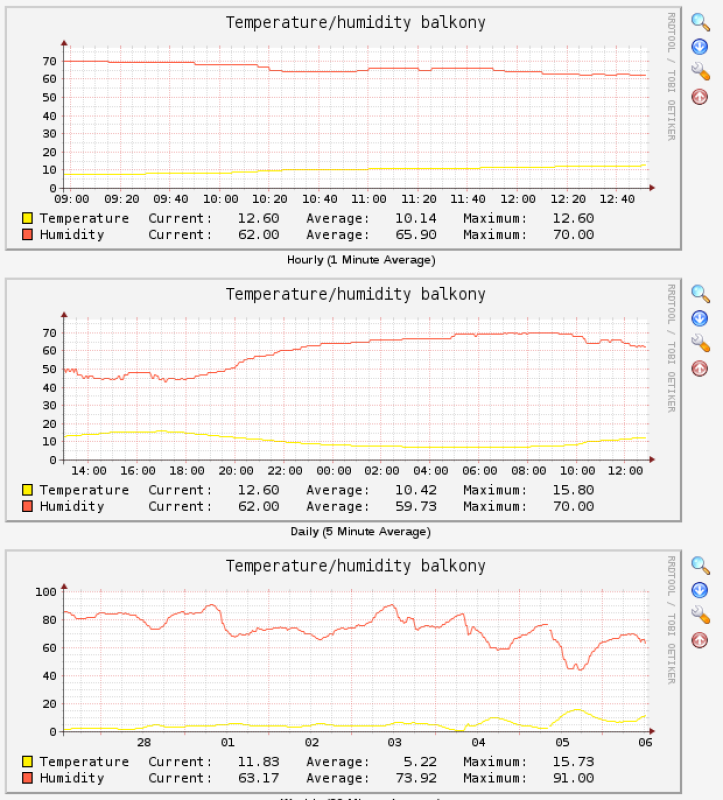 Of course this can be used with all kinds of variables from the homematic. Don’t forget to add the homematic.sh script to the crontab on the system running cacti, so it will refresh the homematic xml data every 5 minutes. |